Platform Usage
Monitor resource consumption across H2O AI Cloud with the Platform Usage dashboard. Track AI Unit usage and Enterprise h2oGPTe token consumption by workspace, user, service, or model.
The platform collects telemetry data continuously. You can view consumption at hourly intervals for recent date ranges or aggregate data to daily, weekly, monthly, or yearly views for longer time periods.
Prerequisites
To access the Platform Usage dashboard, you must belong to both of these groups:
adminstelemetry-admin
To access Platform Usage, navigate to the dropdown on the top right corner, and select Platform Usage:
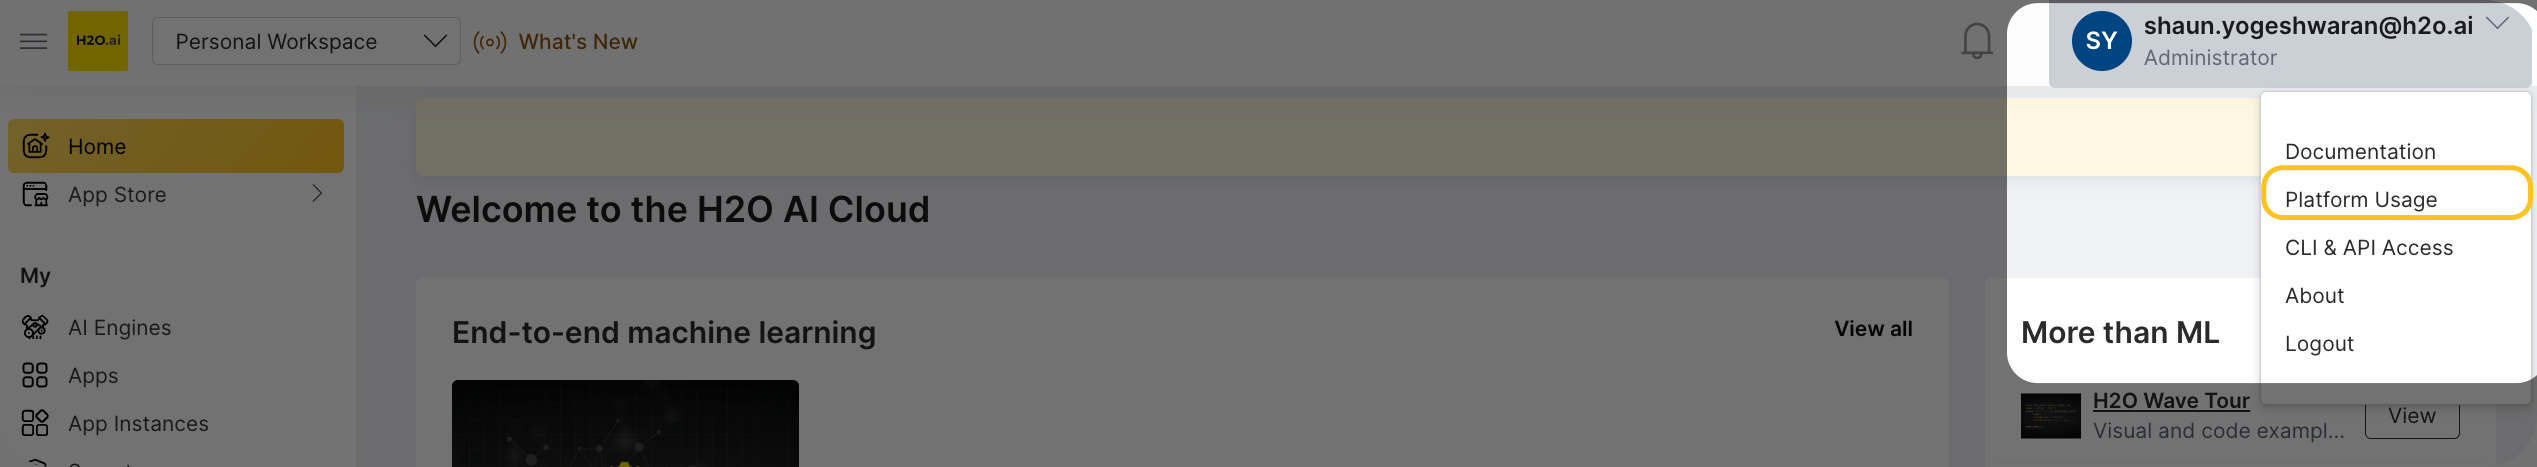
Contact your platform administrator if you need access to these groups.
Accessing Platform Usage
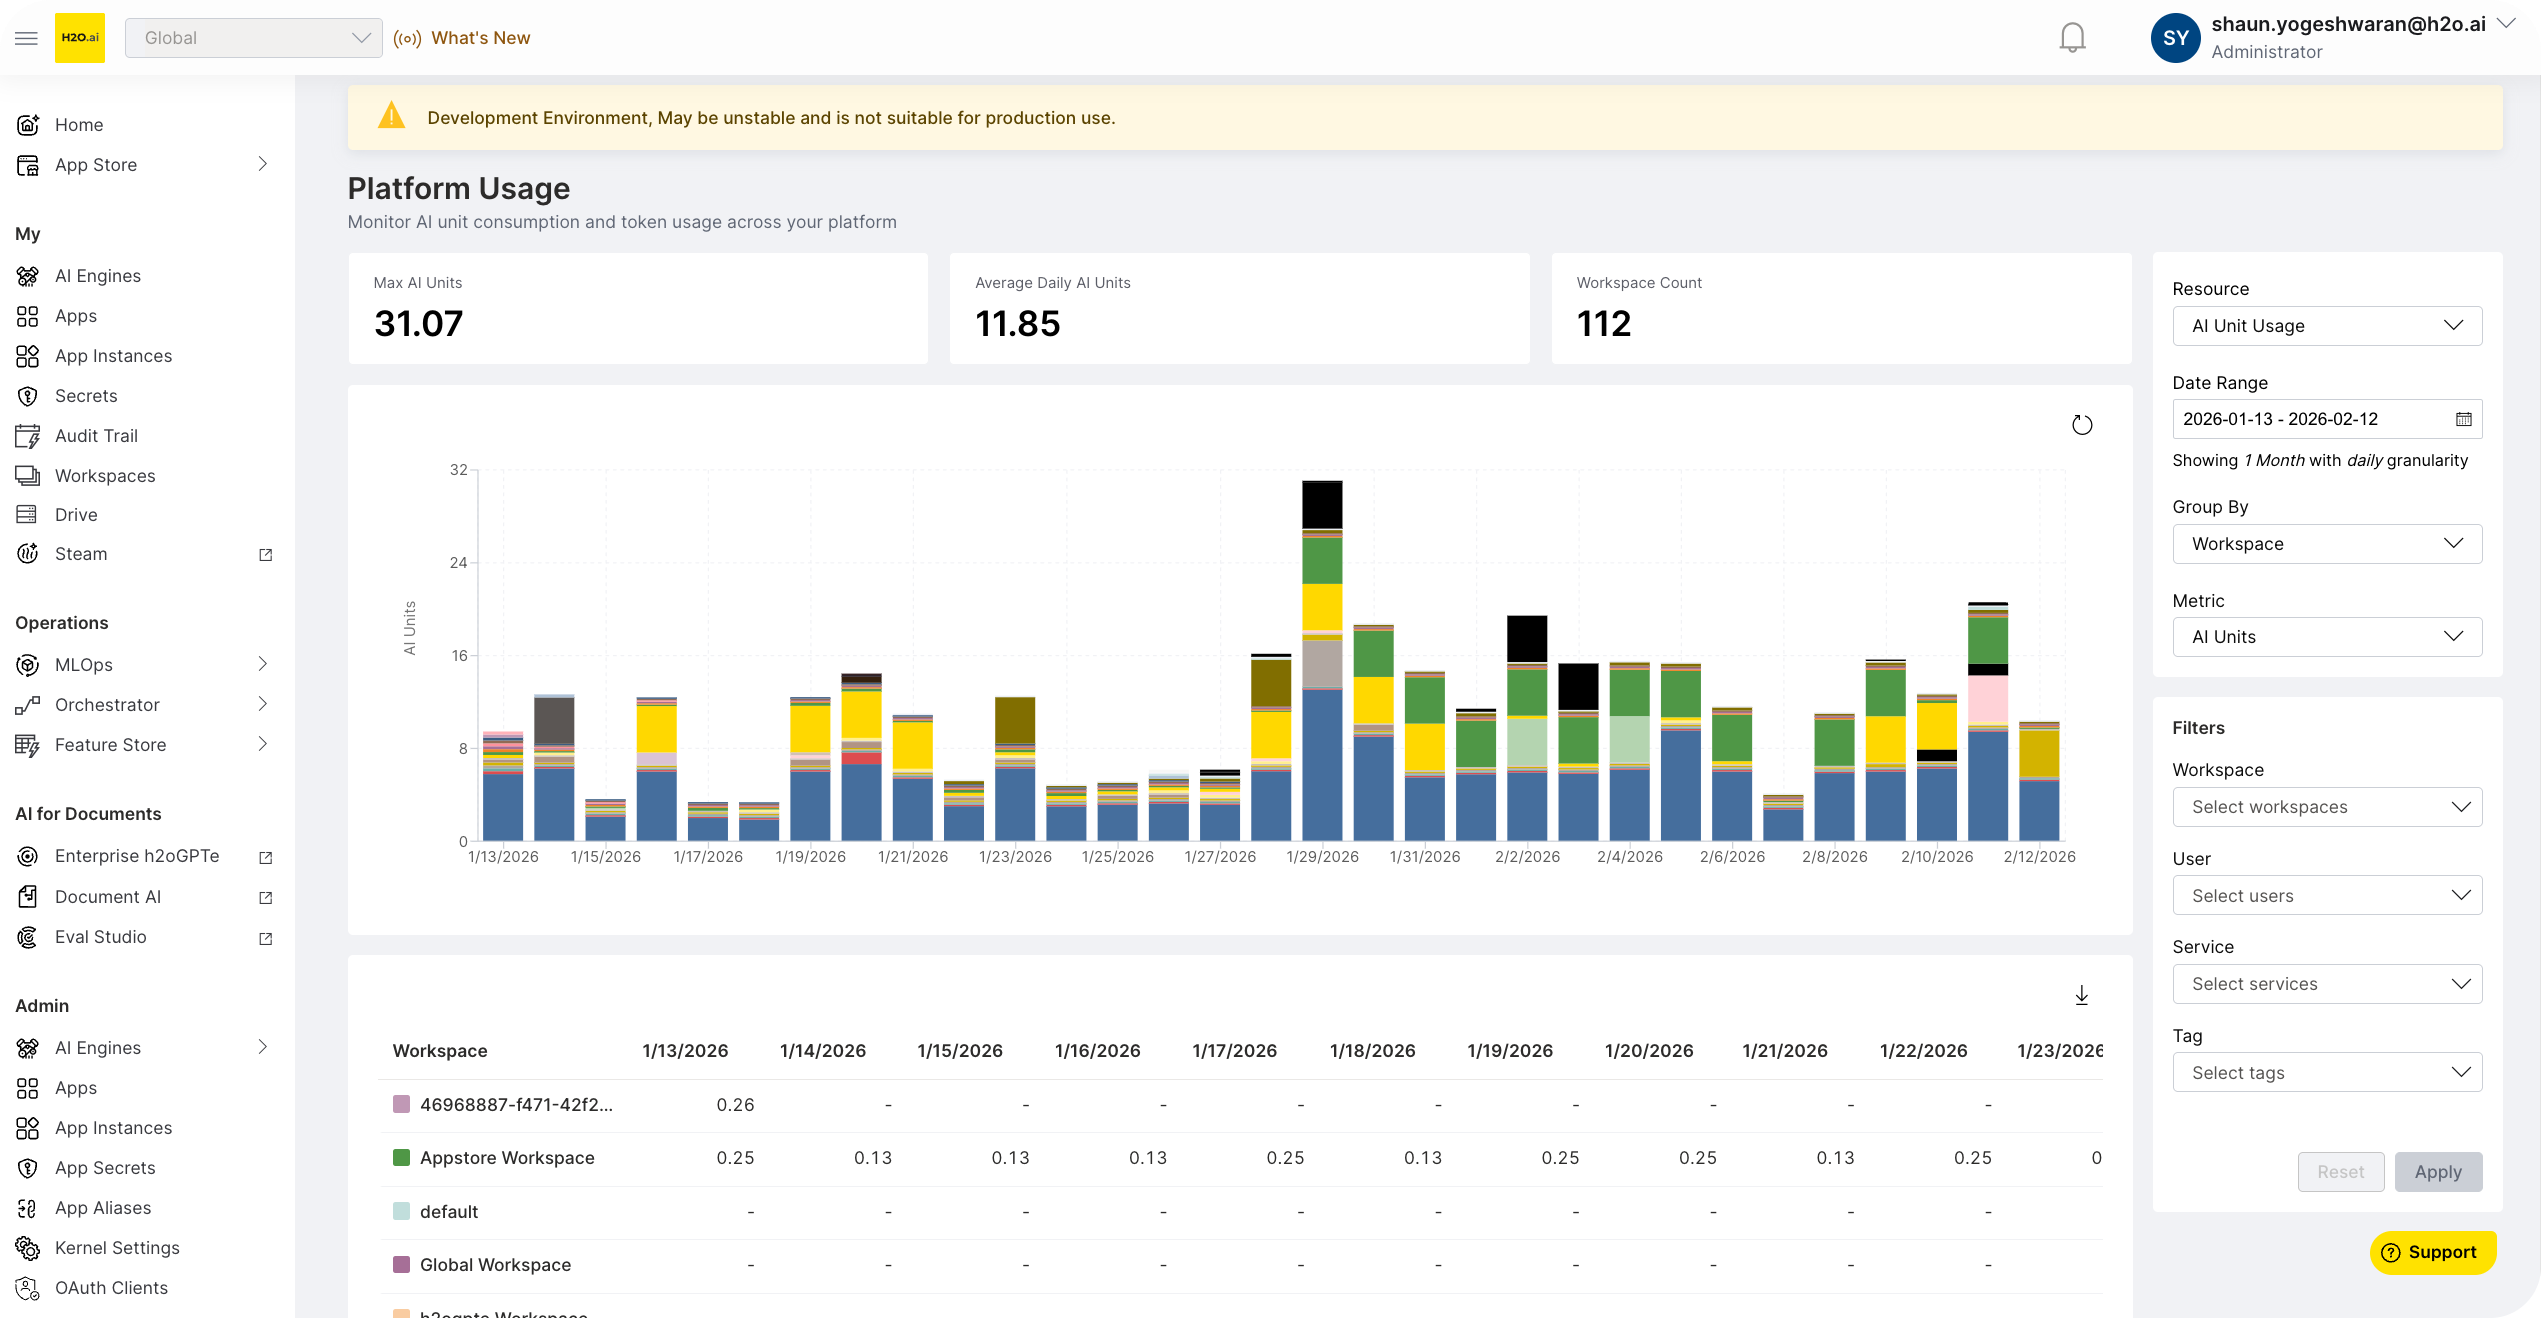
Select Platform Usage from the main navigation menu. The dashboard loads with the default view:
| Setting | Default value |
|---|---|
| Resource | AI Unit Usage |
| Date range | Last 30 days |
| Granularity | Daily |
| Group by | Workspace |
Resource types
The dashboard tracks two resource types. Select a resource type from the Resource dropdown in the filter panel.
- AI Unit Usage
- Token Usage
AI Units are a normalized compute currency that represents CPU, memory, and GPU consumption.
| Capability | Options |
|---|---|
| Group by | Workspace, User, Service, Tag |
| Metrics | AI Units, CPU (Cores), Memory (GiB), GPU |
| Filter by | Workspace, User, Service, Tag |
Tokens represent large language model (LLM) consumption for input prompts and output completions.
| Capability | Options |
|---|---|
| Group by | Workspace, User, Model |
| Metrics | Total Tokens, Input Tokens, Output Tokens |
| Filter by | Workspace, User, Model |
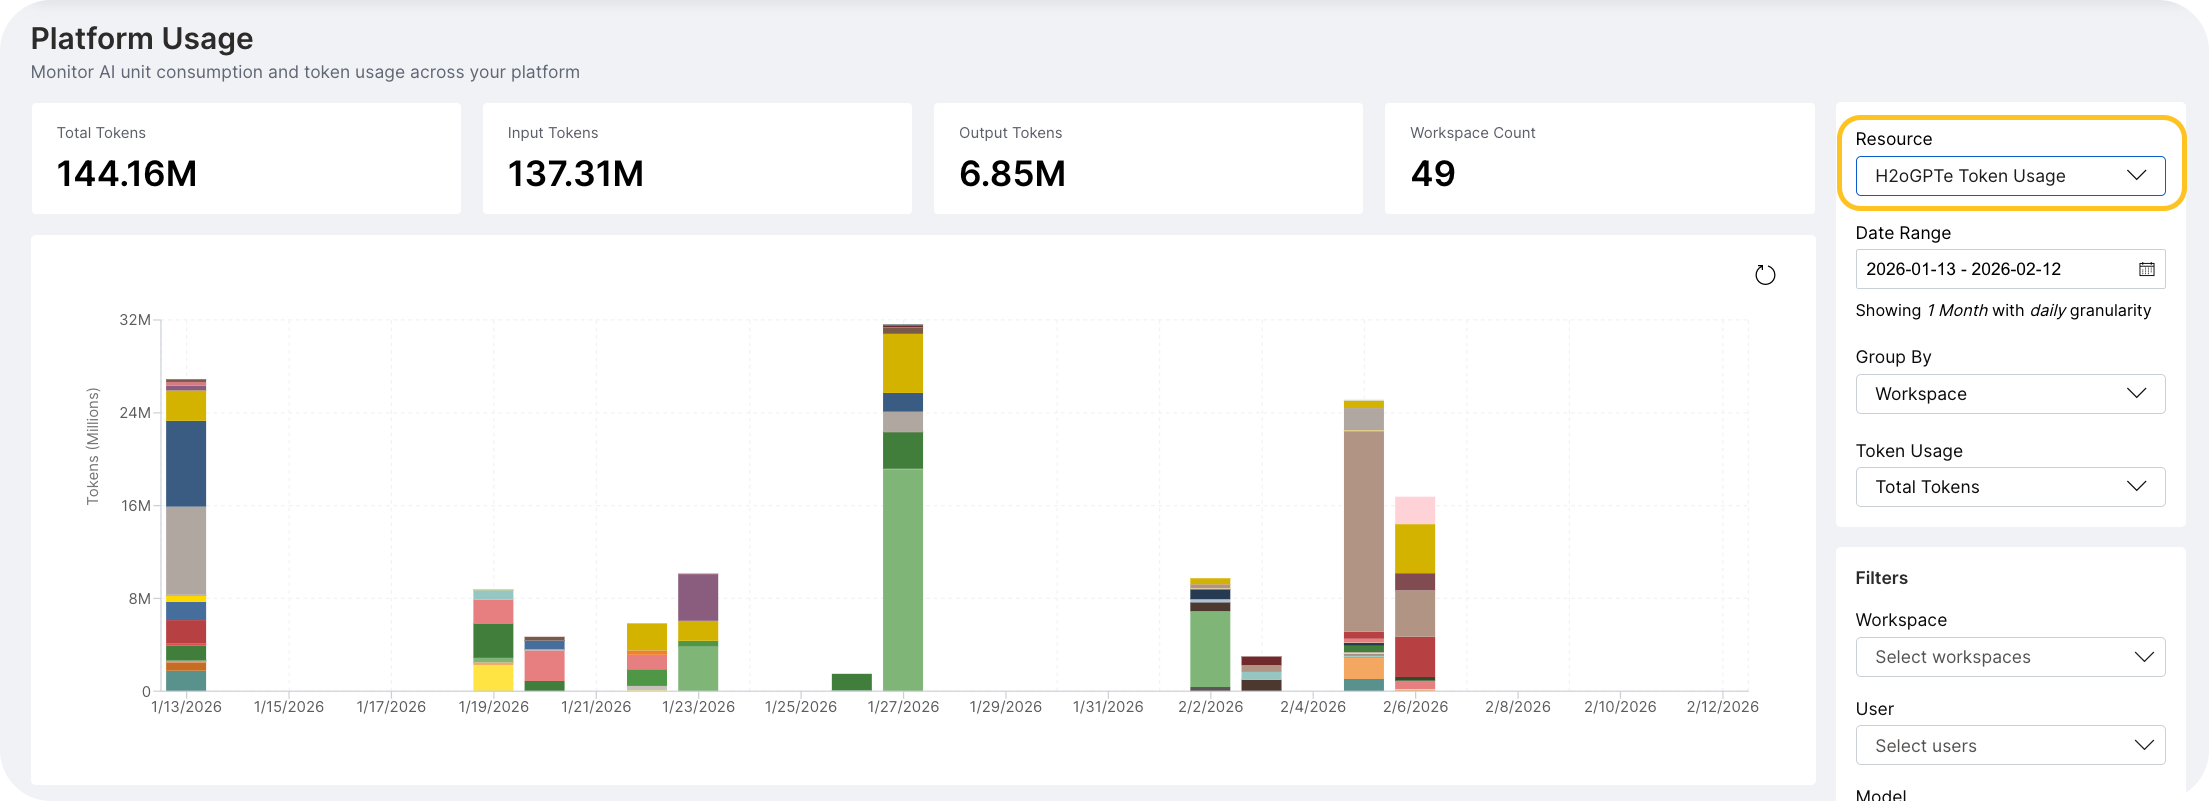
To view Token Usage for Enterprise h2oGPTe, select H2OGPTe Token Usage from the dropdown:
Dashboard components
Statistics cards
Summary cards appear at the top of the dashboard.
- AI Unit Usage
- Token Usage
| Card | Description |
|---|---|
| Max AI Units | Highest single time-period total across all groups |
| Average AI Units | Total AI Units divided by number of time periods (label changes based on granularity, e.g., "Average Daily AI Units") |
| Group Count | Number of unique groups (label changes based on grouping, e.g., "Workspace Count" or "User Count") |
| Card | Description |
|---|---|
| Total Tokens | Sum of all tokens across the date range |
| Input Tokens | Sum of prompt tokens |
| Output Tokens | Sum of completion tokens |
| Group Count | Number of unique groups |
The dashboard displays token values with K (thousands) and M (millions) suffixes for readability.
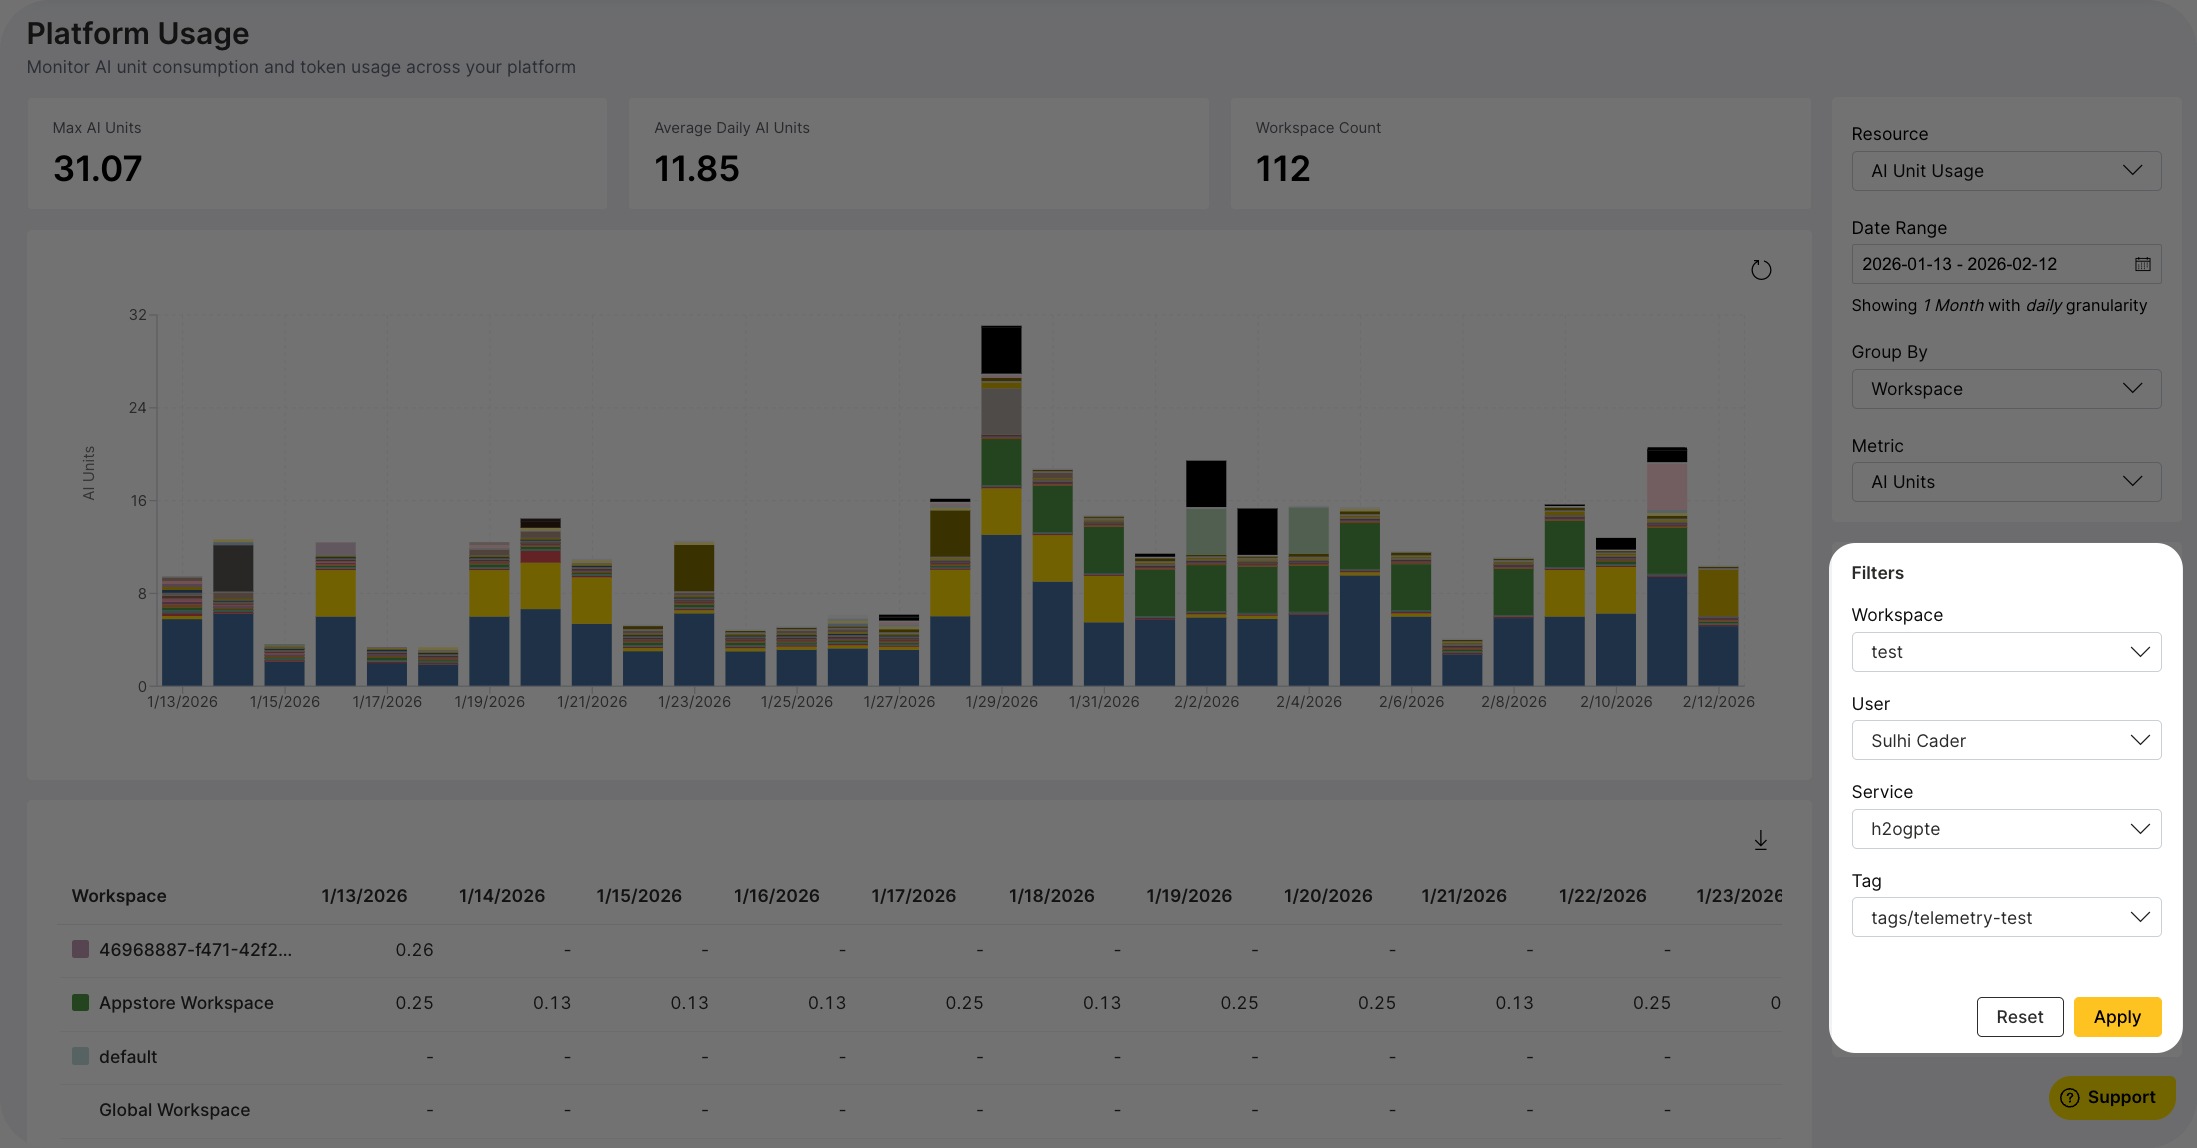
Stacked bar chart
The main visualization displays consumption over time:
- X-axis: Time periods based on the selected granularity
- Y-axis: Metric values (AI Units, CPU cores, memory GiB, GPU count, or tokens)
- Stacked bars: Each color represents one group; bar height shows the total for that time period
To see detailed information, hover over any bar. The tooltip displays:
- Time period label
- Total value across all groups
- Per-group breakdown with color indicators
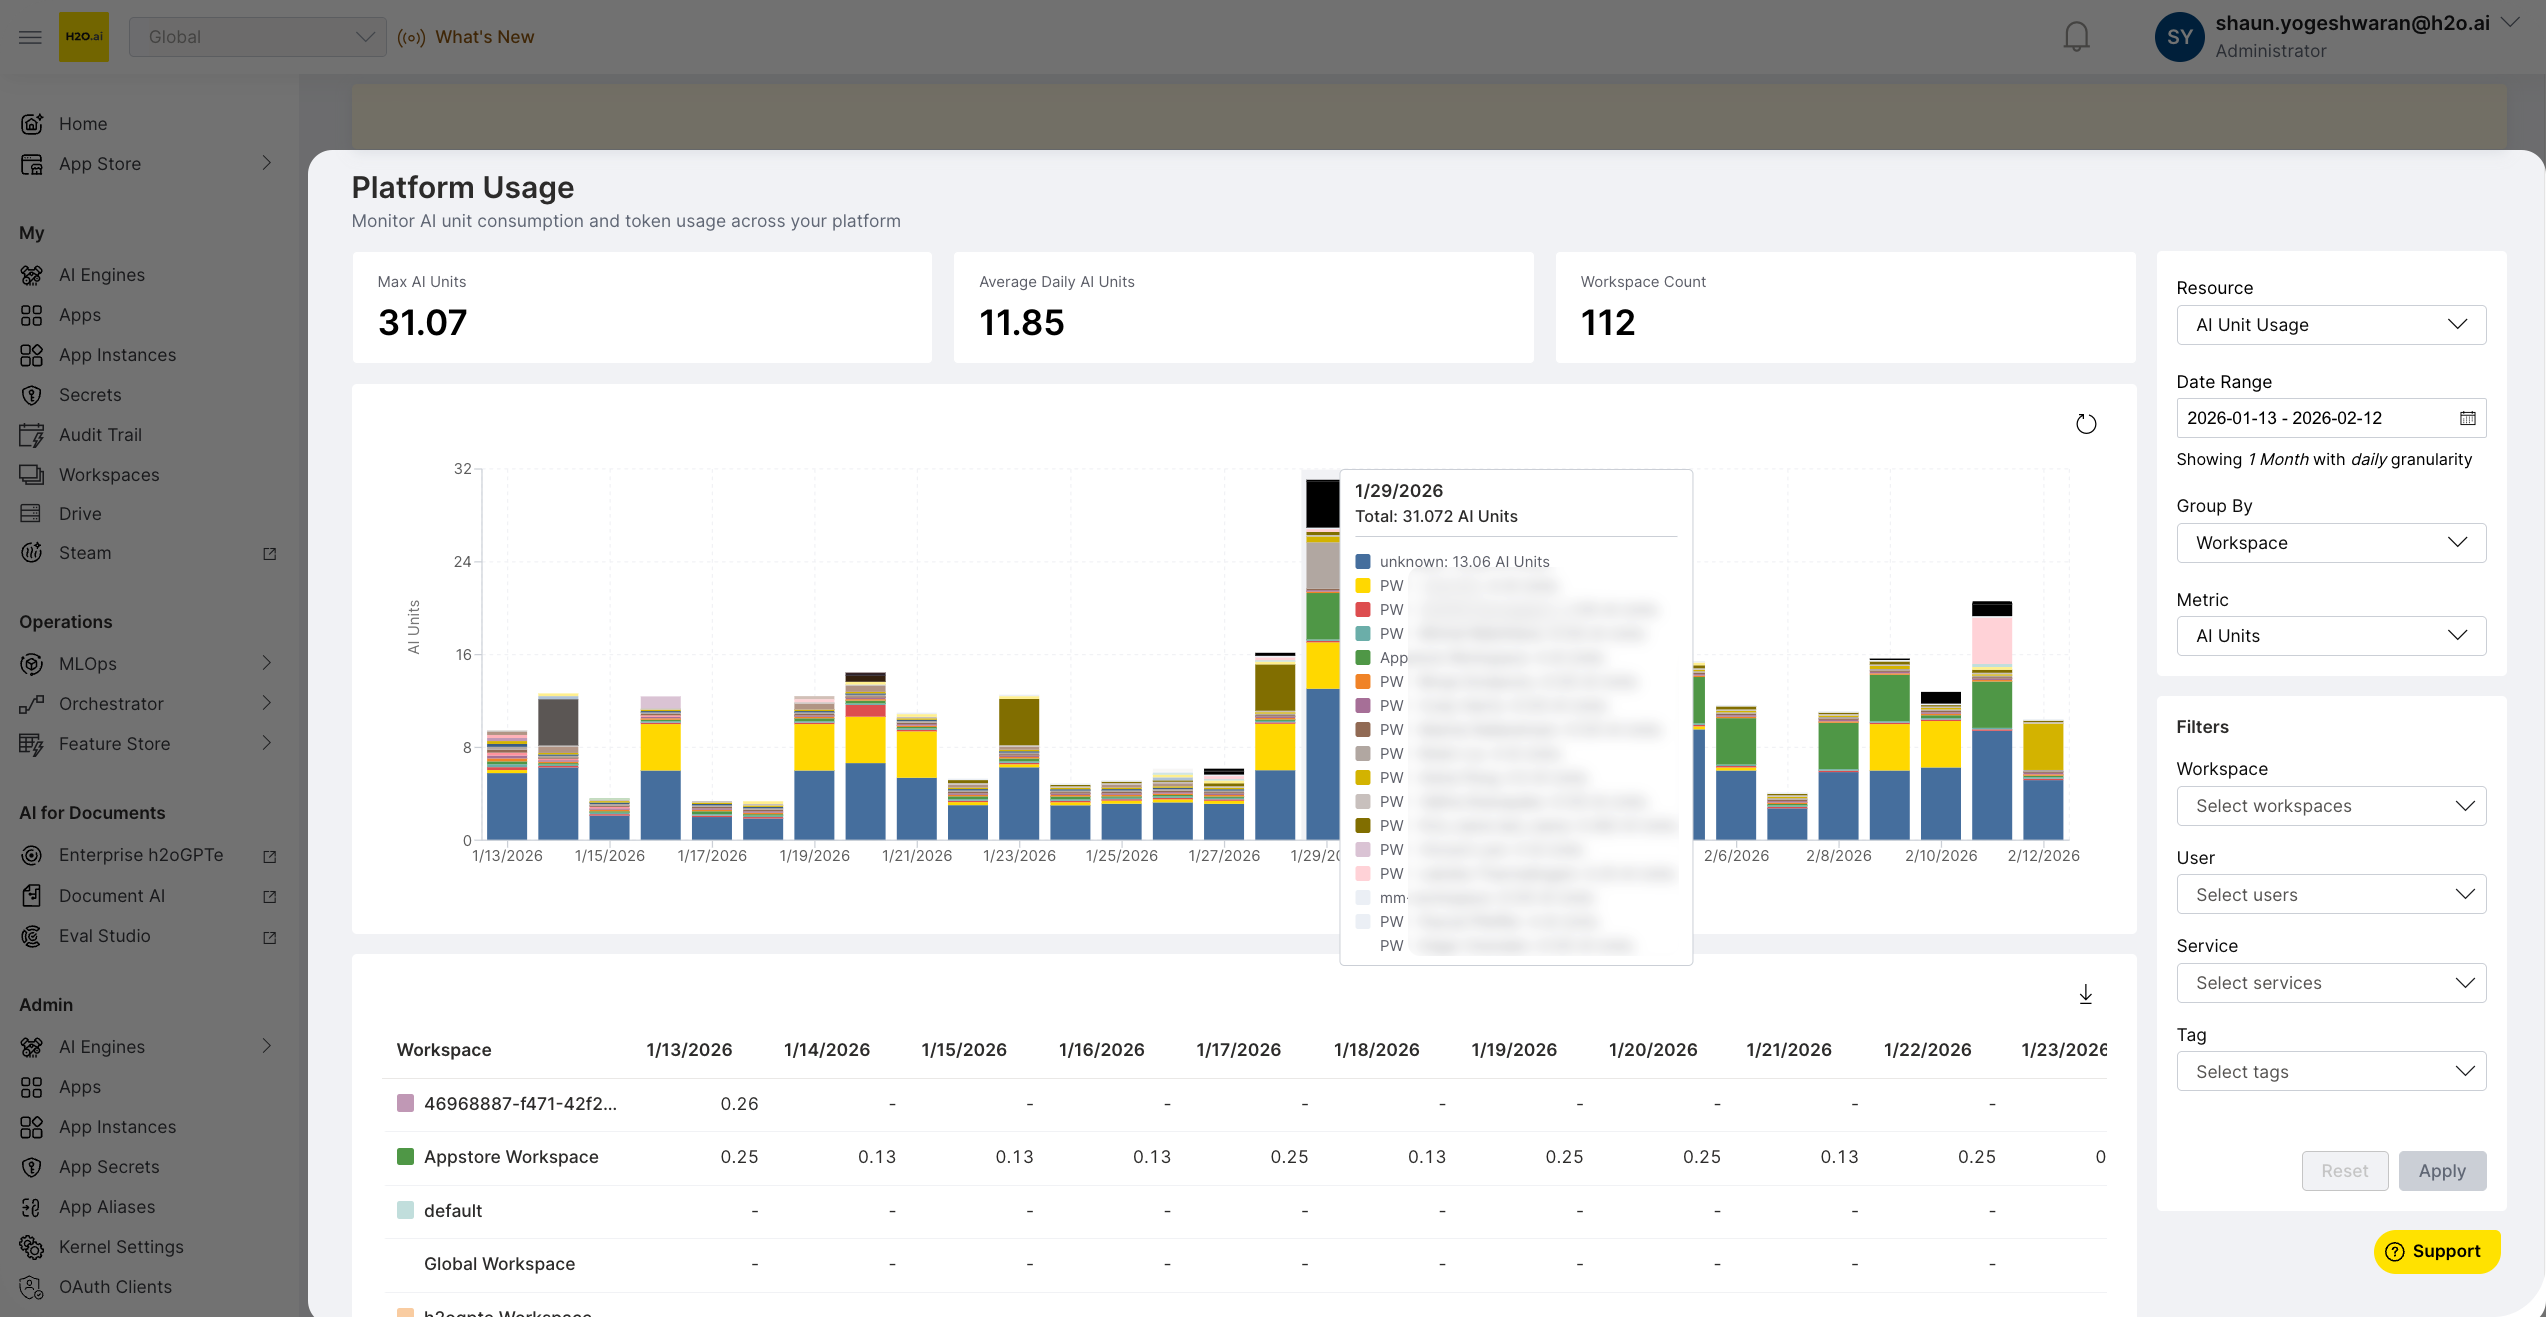
A legend below the chart maps each color to its group name. To reload data, select the refresh icon in the chart header.
Data table
The table below the chart presents the same data in tabular format:
- First column: Group names with color indicators matching the chart (sticky when scrolling)
- Remaining columns: One column per time period (scrollable horizontally)
- Values: Formatted based on metric type (decimals for CPU/Memory, integers for GPU, abbreviations for tokens)
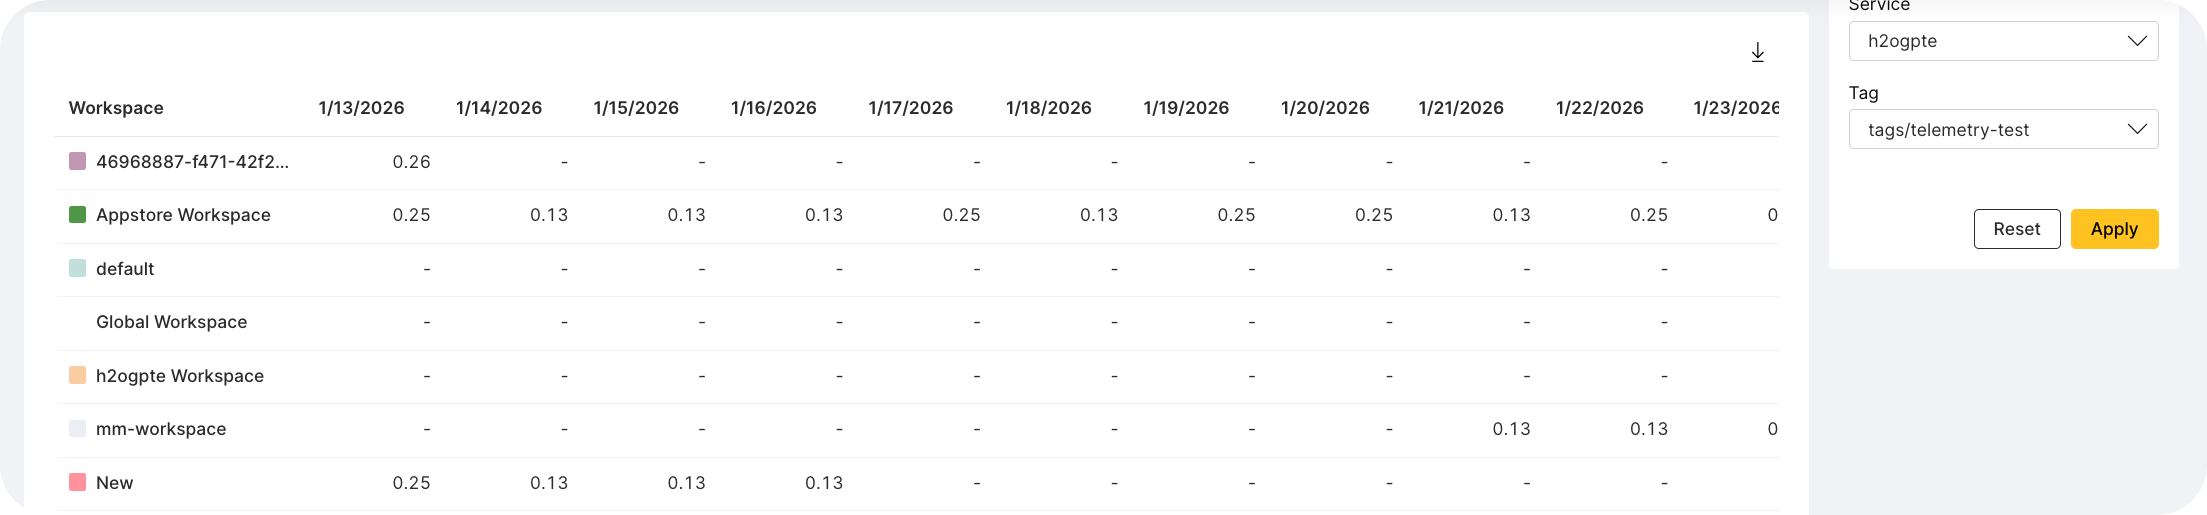
CSV export
To export data as CSV, select the download icon above the data table.
- AI Unit Usage
- Token Usage
Includes all four metrics (AI Units, CPU, Memory, GPU) as separate columns per time period.
Exports the currently selected token type.
File naming: resource_usage_{startDate}_{endDate}_{groupBy}.csv
Filters and controls
All controls are in the filter panel on the right side of the dashboard.
Resource selector
Switch between AI Unit Usage and Enterprise h2oGPTe Token Usage. When you change the resource type:
- The Group By dropdown updates to show resource-specific options
- The metric selector changes to match the resource type
- Entity filters reset to match the new resource type
Date range
To open the date range picker, select the date range button.
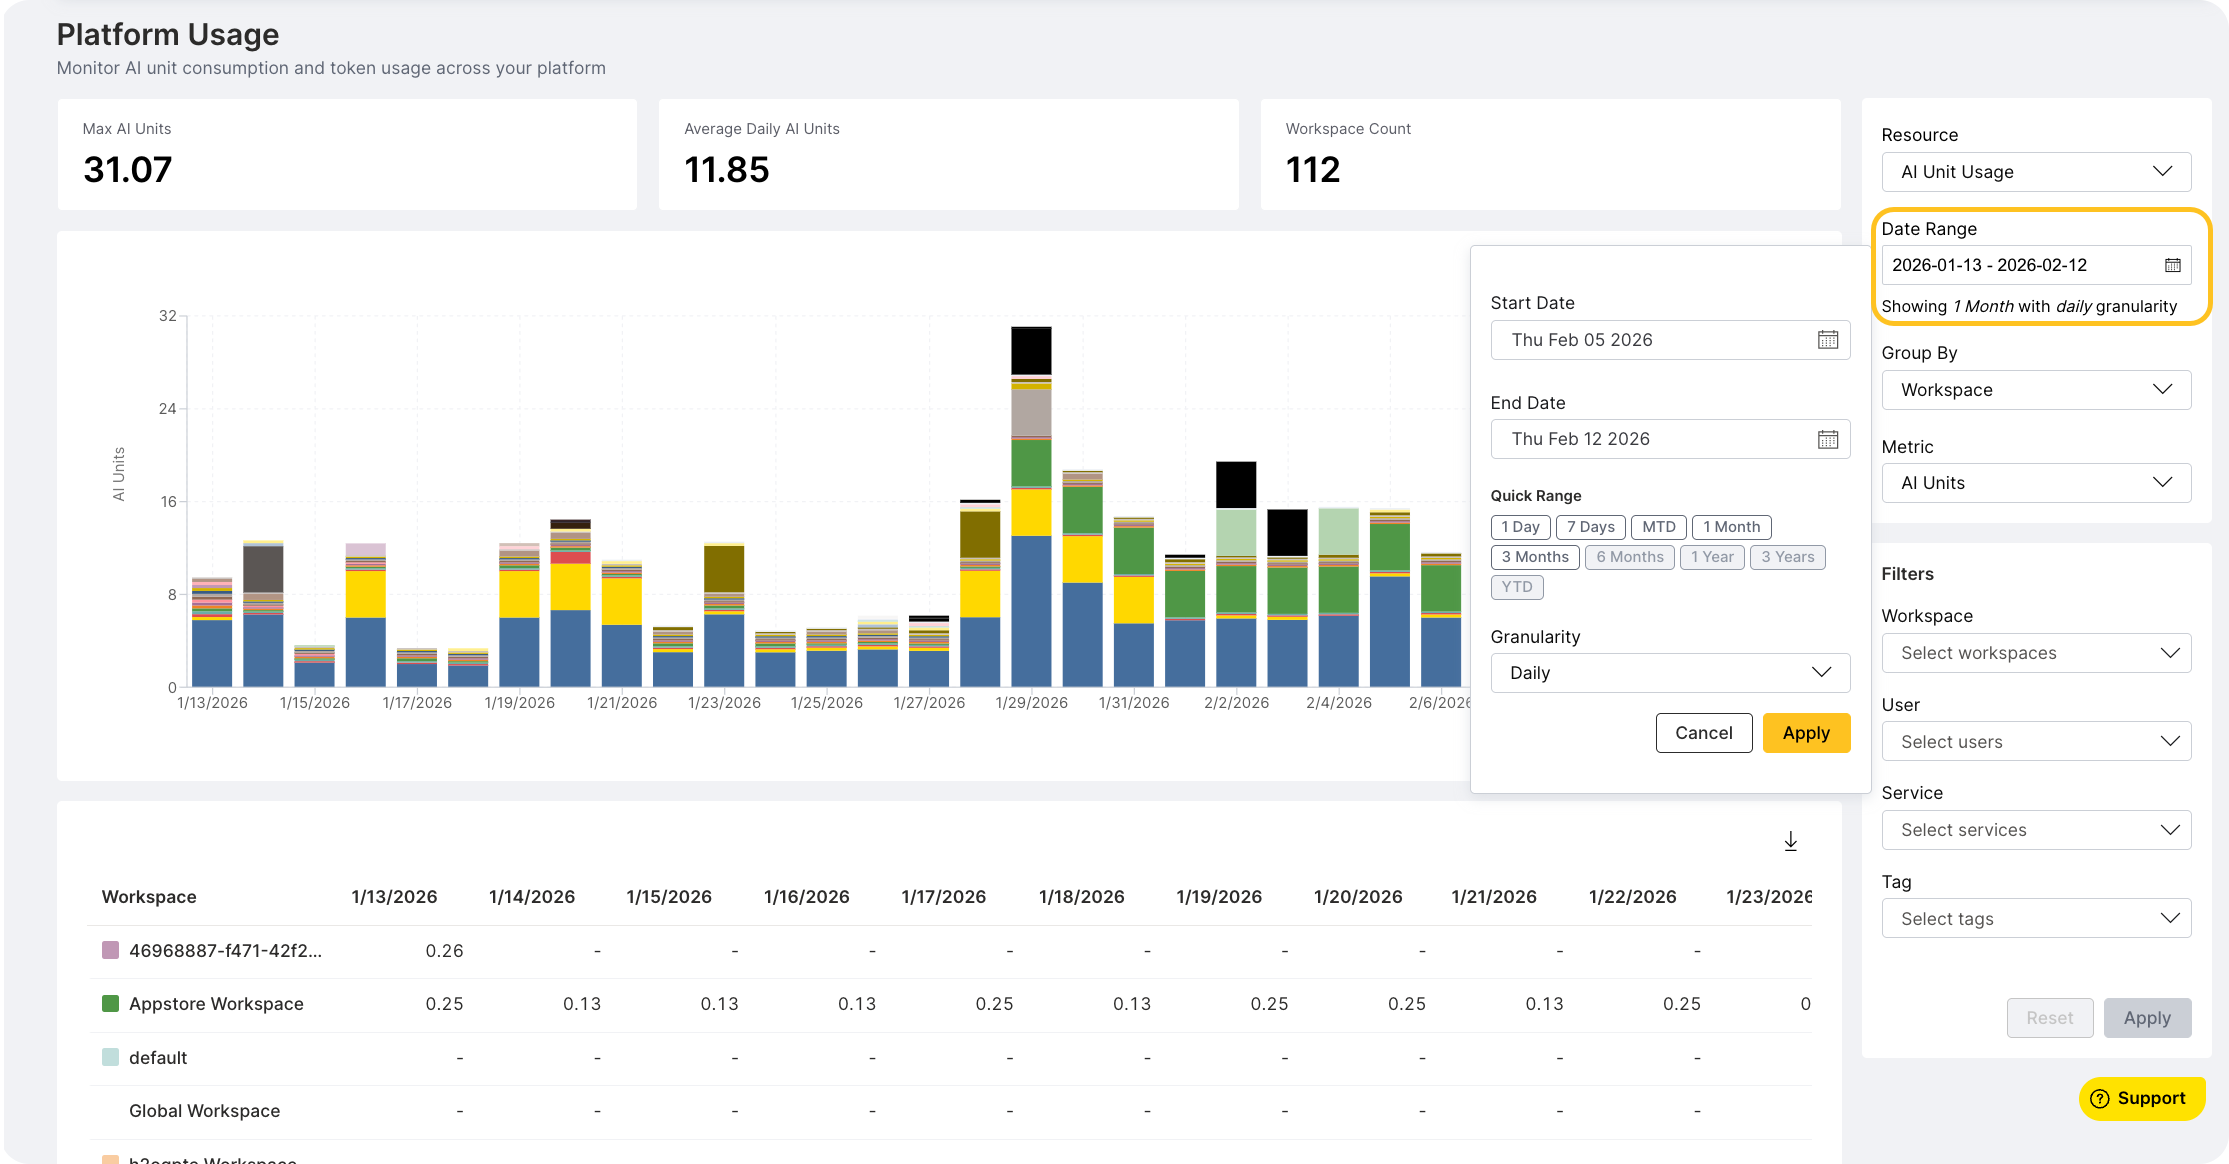
Quick presets (auto-fill dates and granularity):
| Preset | Date range | Default granularity |
|---|---|---|
| 1 Day | Yesterday to today | Hourly |
| 7 Days | 7 days ago to today | Daily |
| MTD | First of current month to today | Daily |
| 1 Month | 30 days ago to today | Daily |
| 3 Months | 90 days ago to today | Daily |
Custom date range: Select any start and end date using the date pickers. The end date maximum is today; the start date maximum is yesterday.
Timezone: All dates display in your browser's local timezone.
A summary below the date range button shows the current granularity setting.
To update the dashboard, select Apply. To discard changes, select Cancel.
Granularity
Granularity controls the time bucket size. Available options depend on the selected date range:
| Granularity | Minimum range | Constraint | Example label |
|---|---|---|---|
| Hourly | Any | Maximum 100 hourly buckets | "1/15, 3:00 PM" |
| Daily | 2 days | Maximum 100 daily buckets | "1/15/2026" |
| Weekly | 14 days | Maximum 100 weekly buckets | "Jan 15, 2026" |
| Monthly | 60 days | Maximum 100 monthly buckets | "Jan 2026" |
| Yearly | 730 days | No maximum | "2026" |
If the current granularity becomes invalid for a new date range, the dashboard auto-corrects to a valid option.
Group by
Select how data is aggregated in the chart and table.
- AI Unit Usage
- Token Usage
| Option | Description |
|---|---|
| Workspace | Group by workspace name |
| User | Group by user display name |
| Service | Group by platform service |
| Tag | Group by resource tag |
| Option | Description |
|---|---|
| Workspace | Group by workspace name |
| User | Group by user display name |
| Model | Group by LLM model name |
Changing the group updates the chart immediately using prefetched data.
Metric type
- AI Unit Usage
- Token Usage
Select which metric to display:
| Metric | Unit |
|---|---|
| AI Units | AI Units (normalized compute) |
| CPU (Cores) | CPU core count |
| Memory (GiB) | Memory in gibibytes |
| GPU | GPU count |
Changing the metric updates the chart Y-axis label and values without refetching data.
Select which token metric to display:
| Token type | Description |
|---|---|
| Total Tokens | Input plus output tokens |
| Input Tokens | Prompt tokens only |
| Output Tokens | Completion tokens only |
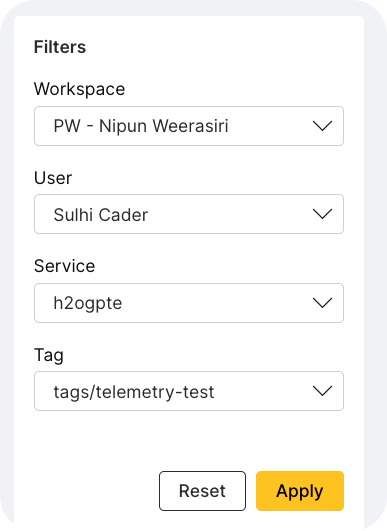
Entity filters
Multi-select dropdowns let you filter data to specific entities.
- AI Unit Usage
- Token Usage
Available filters: Workspace, User, Service, Tag
Available filters: Workspace, User, Model
How to filter:
- Select items in the filter dropdowns. Checkmarks indicate pending selections.
- Select Apply to fetch filtered data.
- Select Reset to clear all filters and show unfiltered data.
Button states:
- Apply is enabled when you have filter selections that haven't been applied yet.
- Reset is enabled when any filters are active (pending or applied).
When you change the date range, all entity filters automatically reset.
Sharing and bookmarking
Dashboard settings persist in the browser URL as query parameters:
- Copy the URL to share your exact view with colleagues
- Bookmark the URL to save a specific configuration
- Use browser back and forward buttons to navigate through your view history
URL parameters
| Parameter | Values | Default |
|---|---|---|
resource | ai_units, h2ogpte_tokens | ai_units |
groupBy | workspace, user, service, tag, model | workspace |
metric | ai_units, cpu, memory, gpu | ai_units |
startDate | YYYY-MM-DD format | 30 days ago |
endDate | YYYY-MM-DD format | Today |
granularity | hourly, daily, weekly, monthly, yearly | daily |
Default values are omitted from the URL to keep URLs concise.
Example URLs
Default view (30 days, daily, workspace, AI Units):
/platform-usage
CPU usage by user for January 2026:
/platform-usage?groupBy=user&metric=cpu&startDate=2026-01-01&endDate=2026-01-31&granularity=daily
GPU usage by service:
/platform-usage?groupBy=service&metric=gpu
Enterprise h2oGPTe token usage by model:
/platform-usage?resource=h2ogpte_tokens&groupBy=model
Weekly workspace usage over 3 months:
/platform-usage?startDate=2025-11-01&endDate=2026-02-01&granularity=weekly
Monthly usage for a full year:
/platform-usage?startDate=2025-01-01&endDate=2026-01-01&granularity=monthly
Hourly usage for yesterday:
/platform-usage?startDate=2026-02-09&endDate=2026-02-10&granularity=hourly
Common tasks
Compare two workspaces over 3 months
- Set the date range to 3 Months with Daily granularity.
- Set Group By to Workspace.
- In the Workspace filter, select the two workspaces to compare.
- Select Apply.
View GPU usage by service for the past week
- Set the date range to 7 Days with Daily granularity.
- Set Group By to Service.
- Set Metric Type to GPU.
Identify which LLM models consume the most tokens
- Set Resource to Enterprise h2oGPTe Token Usage.
- Set Group By to Model.
- Set Token Type to Total Tokens.
- The chart displays token consumption by model.
Export a monthly CPU usage report
- Set a custom date range covering the desired months.
- Set Granularity to Monthly.
- Set Group By to your preferred dimension.
- Select the CSV download button above the table. The exported CSV includes all four metrics per time bucket.
Limitations
- Granularity constraints: If the selected granularity becomes invalid for a new date range, the dashboard auto-corrects to a valid option.
- Filter reset: Entity filters automatically reset when you change the date range. Filter state is not persisted in the URL.
- Metric parameter scope: The
metricURL parameter only applies to AI Unit Usage. It's ignored when viewing Enterprise h2oGPTe Token Usage. - Group by compatibility: The
serviceandtaggroup options are only available for AI Unit Usage. If you switch to Enterprise h2oGPTe Token Usage with these groupings, the dashboard resets toworkspace. - Backward compatibility: The URL parameter
groupBy=componentmaps toservicefor backward compatibility with older bookmarks. - Invalid parameters: Unknown or malformed URL parameter values are silently ignored and defaults are used.
- Submit and view feedback for this page
- Send feedback about AI App Store to cloud-feedback@h2o.ai